线性分类是最简单的机器学习问题之一。为了实现线性分类,我们将使用sklearn的SGD(随机梯度下降)分类器来预测鸢尾花的品种。
步骤
您可以按照下面给出的步骤使用Python Scikit-learn实现线性分类:
步骤 1 − 首先导入必要的包 scikit-learn,NumPy 和 matplotlib
步骤 2 − 加载数据集并构建训练和测试数据集。
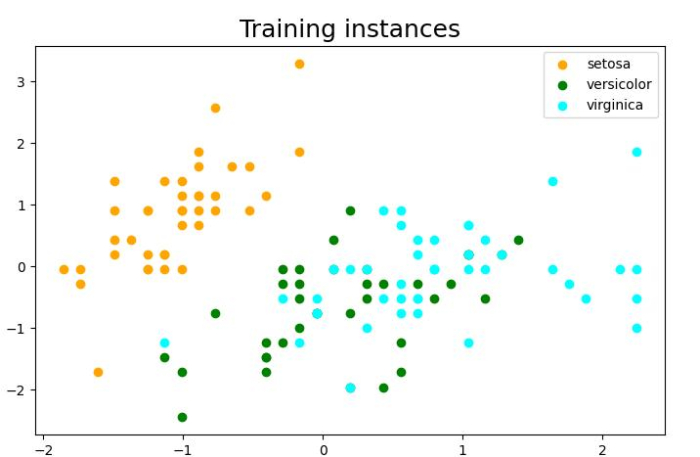
步骤 3 − 使用matplotlib绘制训练实例。虽然这一步骤是可选的,但为了更清晰地展示实例,这是一个好的实践。
步骤 4 − 创建SGD分类器的对象,初始化其参数并使用fit()方法训练模型。
步骤 5 − 使用Python Scikit-learn库的度量包评估结果。
Example
的翻译为:示例
让我们来看下面的示例,我们将使用鸢尾花的两个特征,即花萼宽度和花萼长度,来预测鸢尾花的物种。
# Import required libraries
import sklearn
import numpy as np
import matplotlib.pyplot as plt
# %matplotlib inline

# Loading Iris flower dataset
from sklearn import datasets
iris = datasets.load_iris()
X_data, y_data = iris.data, iris.target

# Print iris data shape
print ("Original Dataset Shape:",X_data.shape, y_data.shape)

# Dividing dataset into training and testing dataset and standarized the features
from sklearn.model_selection import train_test_split
from sklearn.preprocessing import StandardScaler

# Getting the Iris dataset with only the first two attributes
X, y = X_data[:,:2], y_data

# Split the dataset into a training and a testing set(20 percent)
X_train, X_test, y_train, y_test = train_test_split(X, y, test_size=0.20, random_state=1)
print ("nTesting Dataset Shape:", X_train.shape, y_train.shape)

# Standarize the features
scaler = StandardScaler().fit(X_train)
X_train = scaler.transform(X_train)
X_test = scaler.transform(X_test)

# Plot the dataset
# Set the figure size
plt.figure(figsize=(7.16, 3.50))
plt.subplots_adjust(bottom=0.05, top=0.9, left=0.05, right=0.95)
plt.title('Training instances', size ='18')
colors = ['orange', 'green', 'cyan']
for i in range(len(colors)):
   px = X_train[:, 0][y_train == i]
   py = X_train[:, 1][y_train == i]
   plt.scatter(px, py, c=colors[i])

plt.legend(iris.target_names)
plt.xlabel('Sepal length')
plt.ylabel('Sepal width')
plt.show()

# create the linear model SGDclassifier
from sklearn.linear_model import SGDClassifier
linear_clf = SGDClassifier()

# Train the classifier using fit() function
linear_clf.fit(X_train, y_train)

# Print the learned coeficients
print ("nThe coefficients of the linear boundary are:", linear_clf.coef_)
print ("nThe point of intersection of the line are:",linear_clf.intercept_)

# Evaluate the result
from sklearn import metrics
y_train_pred = linear_clf.predict(X_train)
print ("nThe Accuracy of our classifier is:", metrics.accuracy_score(y_train, y_train_pred)*100)
输出
它将产生以下输出
Original Dataset Shape: (150, 4) (150,)

Testing Dataset Shape: (120, 2) (120,)

The coefficients of the linear boundary are: [[-28.85486061 13.42772422]
[ 2.54806641 -5.04803702]
[ 7.03088805 -0.73391906]]

The point of intersection of the line are: [-19.61738307 -3.54055412 -0.35387805]
我们分类器的准确率为:76.66666666666667